Compendium of errors and omissions in:
Risk Of Injury For Bicycling On Cycle Tracks Versus In The Street [[1]]
(article by Anne C. Lusk, Peter G. Furth, Patrick Morency, Luis F. Miranda-Moreno, Walter C. Willett, and Jack T Dennerlein, published in the journal Injury Prevention, Feb 9 2011)
or: What is not in this article
Author: M. Kary, November 2011 [[2]]
Adapted by
John S. Allen,
May 2012
Links refreshed June, 2025
When reading this document…
Formating
This report is available in two formats: PDF, at http://john-s-allen.com/reports/montreal-kary.pdf, has somewhat better appearance and is most suitable for printing on paper. In HTML, at http://john-s-allen.com/reports/montreal-kary.htm, all hyperlinks work, and show in distinctive colours, and external links open in new browser tabs. Viewing the PDF free-standing in a PDF viewer (not in a browser) will also open links separately. In the PDF version, an onscreen menu item rather than a browser’s “back” button returns you to a previous location in the article. Having the document open on a computer will allow you to follow links when reading a paper copy.
Tables, photos and citations are placed at the end of the document, and hyperlinked where referenced. Google Street Views associated with photos may be exchanged for ones from other dates: click on-"see other dates" in the black box at the upper left of the screen. See Google help for how to switch between Satellite View and Street View. Satellite views are recent. For earlier ones, select Historical Imagery in Google Earth Pro.
Compass directions
Montrealers universally describe streets which traverse the island in its long dimension as east-west, though these streets are actually northeast-southwest over most of their length. Correspondingly, streets described as north-south generally cross the island from northwest to southeast. This custom accounts for differences between compass directions in street names and captions and those in linked Google maps. As an aside, and significant as a safety issue, this street orientation avoids problems with glare from the rising and setting sun.
1 Incorrect descriptions of the intervention group sample
1.1 de Maisonneuve between Claremont and Wood
1.2 Christophe Colomb between Gouin and Jarry
1.3 Rachel between St Urbain and Marquette
1.4 Berri between Viger and Sherbrooke
2 Inadequate characterizations of the intervention and comparison streets
3 Divergent characteristics of the intervention and comparison streets
5 Inappropriate or missing statistical analysis.
5.4 Construction of the reference and intervention samples
6 Incorrect representation of statistical results
6.1 No crash data for comparison streets
6.2 Crash rates described as injury rates
7 Body of literature that came to opposing conclusions
8 Drawing policy implications despite failure to consider the problem systemically
Table 1. Brébeuf path, Rachel to Laurier (Barrette)
Table 2. De Maisonneuve path, Claremont to Greene, two streets short of Wood.
Table 3. Berri path, Viger to Cherrier
Table 4. Christophe Colomb path, Jarry to Gouin
Table 5. Rachel vs. Mont-Royal
Christophe Colomb group photos
Brébeuf group photos (all facing north)
Figures
Figure 1: de Maisonneuve at Clarke
Figure 2: de Maisonneuve at Claremont
Figure 3: de Maisonneuve at Lansdowne
Figure 4: de Maisonneuve downtown section
Figure 5: Christoph Colomb at Jarry
Figure 6: Christoph Colomb at and near Émile Journault
Figure 7: Christoph Colomb at Fleury
Figure 8: Christoph Colomb at Gouin
Figure 11: Berri at Sherbrooke and Ontario
A Compendium of errors and omissions in the Lusk, Furth et al Study of Safety on Cycle Tracks vs. in the Street,
or: What is not in this article
M. Kary
April 2012
In the journal Injury Prevention[[3]] Lusk et al. ask whether cycling in (what they describe as) two-way, one side of the street, physically separated bicycle paths in Montreal is as safe as cycling in comparable streets without such separated paths. Short articles, such as are required by Injury Prevention, tend to leave out much that is important and sometimes even crucial. The following comments concern crucial missing items that readers must be aware of in order sensibly to evaluate the authors’ claims, and also describe numerous other problems with the work.
All epidemiological studies are made or broken by the details of how the authors obtained their intervention group, how they chose the comparisons, and how they constructed their statistics. This study by Lusk et al. is marked by at least the following problems:
- incorrect and inadequate descriptions of the bicycle paths and their associated streets;
- no descriptions of the comparison streets;
- an unsound selection of comparison streets, which the authors went up to 10 blocks away to find;
- reliance on an untested indicator of danger to cyclists, one whose usefulness is refuted by the authors’ own data;
- methods that are in conflict with the authors’ own concurrent findings published elsewhere;
- inappropriate statistical analysis;
- incorrect representation of statistical results;
- lack of any sensitivity analysis on the major sources of uncertainty in their indicators of exposure and effect;
- lack of consideration of divergences between the cycling populations that use the paths or the streets;
- lack of consideration of how the presence of the bicycle paths has changed traffic flows on the comparison streets;
- avoidance of nearly all of the pre-existing literature that came to opposing conclusions;
- the drawing of policy implications despite failure to use a systemic approach that would have considered in addition, if nothing else, harm to pedestrians.
1 Incorrect descriptions of the intervention group sample
The authors describe their intervention group sample as consisting of six cycle tracks in Montreal that are all two-way on one side of the street. This is incorrect, as are further details of the individual path segments as follows.
1.1 de Maisonneuve between Claremont and Wood
(See de Maisonneuve group photos.)
Authors’ description: street level, separated from traffic by delineator posts.
Approximately 16% of this path segment is neither separated from traffic by delineator posts nor even on any street: instead it traverses the entire width of a large park, where there are no streets and no intersections and there is no motor vehicle traffic. The comparison streets do not traverse any park.
During almost the entirety of the authors’ 1 Apr 1999 – 15 Nov 2008 study period, this path ran only from Claremont to Greene, two blocks short of Wood, for a distance of approximately 1.56 km instead of the 1.9 (which in reality is closer to 1.75) listed by the authors. The incident rates for crashes and injuries per kilometre along this segment are therefore approximately 22% higher than as listed by the authors (see also Section 1.3). The path extension to downtown, and so to Wood, was opened only in the late summer of 2007.
Moreover, the entire segment studied is not in the City of Montreal, but is instead in the City of Westmount, which was a borough of Montreal only from 1 Jan 2002 to 31 Dec 2006. Westmount is one of only two places in the province of Quebec with an all-ages bicycle helmet ordinance. The existence of this law, allowing for fines of up to $2,000 and nominally in effect since 1994, is not indicated by signage anywhere except along the de Maisonneuve path (see Figure 1B). Even though violators are no longer cited for violation of the helmet ordinance anywhere in Westmount, and perhaps never were anywhere but the path, this is not publicized, and the signage may change the characteristics of the population that chooses to use that path rather than parallel streets where there is no signage.
The authors need to explain how they obtained the cyclist count data for this path, the nature of the data and the period of collection. Unlike the City of Montreal, the City of Westmount does not maintain automatic counters as described by the authors[[4]] [[5]], nor does the City of Montreal maintain such counters on Westmount territory.
1.2 Christophe Colomb between Gouin and Jarry
(See Christophe Colomb group photos)
Authors’ description: sidewalk level, separated from motor traffic by virtue of being on the sidewalk, and additionally in some sections by a “planting strip”.
No more than about one quarter of this path is well-pictured by the authors’ description. Approximately one-third traverses what is, from a cyclist’s point of view, more like a park or a park-like setting, having no interaction with Christophe Colomb, often above sidewalk level, and with hardly any intersections. Slightly more is on-street, separated from parallel traffic by raised medians with delineator posts and a parking lane. A short section has one direction on the sidewalk and the other on-street with delineator posts; while another short section is entirely on-street, separated from parallel traffic (which in that section is extremely light) by delineator posts (see photos below, and also photos and analysis in the earlier response to Lusk et al. by W. Pein [[6]].
1.3 Rachel between St Urbain and Marquette
(See Rachel group photos.)
The authors list this path segment as being 3.5 km long. In fact it is approximately 1.7 - 1.8 km long, and thus has approximately twice the rates of injuries and crashes per kilometre given by Lusk et al. (The authors need to explain how they obtained the lengths they give for all their path segments.)
As an aside, in order to obtain incident rates per kilometre, the authors assign subjective correction factors to the lengths of their segments. These subjective factors, ranging from 60% to 90%, were determined by “expert judgement”. No indication of how one might become expert at judging such things is provided by the authors. Nor do they provide any expert judgement of the error distribution of these expert judgements. The resulting overall incident rates per kilometre are therefore not only incorrectly calculated, due to, at least, the de Maisonneuve and Rachel path-length errors— the latter an expert error of approximately 100%— but also are fundamentally of no scientific value.
1.4 Berri between Viger and Sherbrooke
(See Berri group photos.)
One of the study’s authors has said on local television that two intersections on this path, Berri at Viger and Berri at Ontario, are respectively the second- and third-worst bicycling injury blackspots for the entire island of Montreal. (The worst, Mont-Royal at Park Avenue[[7]], is a short distance outside the Mont-Royal segment studied by the authors, because Rachel, the corresponding path street, does not reach Park Avenue. The fourth-worst is on the Christophe Colomb path segment.) Given the short length and the small number of intersections on the path segment studied here, the authors should explain why the injury totals they give here nevertheless do not seem to reflect this, and why they do not mention the blackspot record of this path.
2 Inadequate characterizations of the intervention and comparison streets
The authors give no description of the intervention streets beyond whether they are one-way or two-way, and no description of the comparison streets other than that they are parallel to, and begin and end at the same cross streets as, their respective intervention streets. In particular, the authors give no information on characteristics that have been studied in the literature or that cyclists pay attention to, such as posted speed limits, actual motor vehicle and bicycle speeds, numbers and widths of lanes, traffic volumes, condition of the pavement, neighbourhood type, and presence of heavy vehicles, bus routes, or metered parking. Even though accidents at intersections, both crashes and crushes, are the biggest safety problem with physically separated bicycle paths, the authors do not tell us the numbers and types of intersections traversed by the reference and intervention streets. Rather, the authors say (wrongly, see tables and photos) that they are similar, by virtue of the overall segments beginning and ending at the same cross streets.
Rather than detailing features relevant to
cycling, the authors rate traffic danger based only on the numbers of injuries
to motor vehicle occupants, saying that “MVO injury counts are considered a
surrogate for traffic danger a bicyclist might face on a given street apart
from any treatment.” This statement is not credible for at least the following
reasons:
- Although the authors phrase their statement as if MVO injury counts were routinely used this way, they provide no citation to demonstrate that.
- The authors’ own data refute the claim: a scatter plot of their bicyclist injury rates versus motor-vehicle operator injury counts on non-treatment streets shows a cloud with only a vague overall association, giving an r2 of only 0.58.
- Entire categories of incidents, such as dooring, or being crushed beneath the wheels of a vehicle traveling in the same direction which turns across the bicyclist’s path, can cause grave injuries to bicyclists, but are of little if any concern to motor-vehicle occupants. Danger is omnipresent for the cyclist making his or her way along congested urban streets with narrow lanes, while motorists instead are concerned mostly either with fender-benders or with hitting cyclists and pedestrians.
- The concept of comparing reference and intervention streets via an indicator, measured after the bicycle path is in place, of “traffic danger... apart from any treatment” has not been well thought out. The creation and persistence of a bicycle path changes the characteristics of cyclist and motor vehicle traffic on both streets. For example:
o In the downtown area, de Maisonneuve, one-way westbound, was previously an ideal artery for westbound motorists turning in the most usual direction, to the south. Now they must turn across a two-way bicycle path with unpredictable, sometimes high speed, nearly continuous traffic, to which they are required to yield. This has made Sherbrooke Street, despite its two-way automobile traffic, a relatively more attractive option. The diversion of the traffic flow has, however, made Sherbrooke less safe for cyclists. Similarly, Berri is a preferred north-south route for motor traffic because of its simple traffic pattern and the underpass that avoids the intersection at Sherbrooke; but vehicles turning west must now contend with difficult bicycle traffic, thus making St Denis relatively more attractive to motorists, and less safe for cyclists.
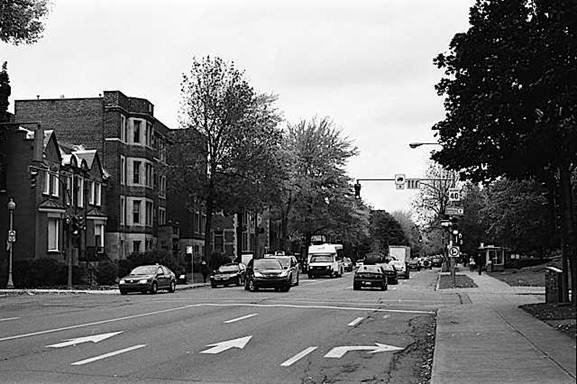
o Posted speed limits are sometimes lowered, sometimes raised, when paths are installed. Thus the posted speed limit for Brébeuf is 30 km/hr (19 mph), while the posted speed limit on the nearly identical adjacent streets is 40 km/hr (25 mph). The authors instead went 10 blocks away to find their comparison street, where the posted speed limit is 50 km/hr (31 mph). The difference in speed limits also diverts traffic, and thus further reduces safety for cyclists on the non-path streets. (See Brébeuf group photos.)
o High-speed cyclists such as couriers avoid the clogged bicycle paths during rush hours, and tend to use adjacent streets instead.
3 Divergent characteristics of the intervention and comparison streets
This study cannot be sensibly evaluated without at least some basic photographic and cartographic comparison of the reference and intervention streets. Likewise, the authors should have detailed standard characteristics such as number of lanes, posted speed limits, actual speeds, condition of the pavement, and number and nature of intersections. Since the authors provide no such documentation, I take the opportunity to supply some of it here.
Tables 1 to 4 provide missing relevant characteristics of the intervention and reference streets in the five (out of eight) cases where the authors found the intervention to be safer. Table 5 does the same for the Rachel – Mont-Royal comparison, one of the three cases where the authors found the comparison street to have a lower injury rate. Numbers of intersections are estimated from a 2003 (middle of the study period) map [[8]] or counted on-site, and do not include driveways or the delimiting cross-streets. Distances are either as given by Lusk et al. or in the case of large errors on their part (de Maisonneuve group and Rachel group; to a lesser extent St. Hubert), as measured from the map.
Table 5 does the same for one comparison (out of three) where the reference street had a better record. The photographs and their captions demonstrate further important differences between the intervention and comparison streets.
Further photographs and a corroborating analysis may be found in the earlier response by W. Pein [[9]].
4 Lack of any sensitivity analyses of sweeping assumptions, and methods that conflict with the authors’ own results published elsewhere
4.1 Exposure
The authors state that they “measured bicycle exposure directly”. In fact, for their 1999-2008 study period, they used short non-random sample counts for 2000 and 2008 only, for the intervention streets only (no more than 20 to 64 days over 5 months out of 229 days in 7-month seasons). The authors used interpolation and back-extrapolation for the rest of the intervention data. The authors, then, accounted only a for a growth trend, and not for year-to-year fluctuations. On the other hand, their injury data seem to cover each year for the complete season, with all the inherent fluctuations.
For the comparison streets, no such exposure time series are available, and instead the authors apparently used counts from a single 2-hour period sometime in 2009, made simultaneously with a count on the intervention street. This was then used to establish a single fixed ratio of intervention to comparison street exposure that was used for the entire 1999 - 2008 study period. The authors state that “Using a ratio of simultaneous counts eliminates systematic effects on bicycle use such as weather, time and day.” The authors provide no sensitivity analysis for this sweeping assumption, which is dubious on the face of it:
- The cyclist’s choice to use a path or an alternative street, and so the overall distribution of ridership between the two, depends on conditions which may vary from hour to hour, day to day, and year to year. This especially in a city such as Montreal with severe pothole problems, extensive summer roadwork, and frequent gridlock. Thus for example the present writer recently wanted to ride along Sherbrooke Street during rush hour, but because of road construction particular to this summer and gridlock particular to that time and date detoured onto the cycle paths and then onto a distant street.
- The method conflicts with the authors’ own results published elsewhere[[10]]. There they found that exposures on even nearby paths in Montreal do not vary in lockstep: on the contrary they found that “the variability of the magnitudes and significance of certain coefficients [in their fitted models of exposure] confirms the need for path-specific models.” Considering that the reference-intervention pairs of the current study may be up to 10 blocks apart, or separated by features of the urban geography that bifurcate the respective cycling populations and their destinations, the onus is entirely on the authors to demonstrate that a result similar to what they found in similar circumstances, for some reason does not hold similarly.
4.2 Injury
The authors want to count injuries that occur to cyclists travelling specifically along their chosen segments, and not crossing them at intersections. Yet their ambulance services data do not contain this information. The authors used instead an overlapping dataset, police reports, to get a ratio of through-traffic to cross-traffic injuries for each intersection, and applied this as a correction factor to the ambulance data.
Intersections represent the primary safety problem for physically separated bicycle paths. Therefore these correction factors must be key to all of the authors’ results. Given the low rates of injuries overall, and the very low rates of reporting to the police, the data from which the correction factors are constructed must be very sparse and the reliability of the factors entirely uncertain. Yet, as with all their assumptions, the authors provide no sensitivity analysis. Nor do they give any idea of the distributions or quantities of these data.
Furthermore, the entire concept of excluding injuries to cyclists coming from or going to cross streets is questionable, because some of these injuries occur specifically because of the presence of the path, in at least three ways:
- Some cyclists are going out of their way along the cross-street precisely in order to get to or from the path. In so doing they have exposed themselves to extra risk not only from the path intersection, but also from any others along the way.
- Cyclists ride opportunistically, and their crossing behaviours are affected by constraints. For example, to turn left onto a cross street, an unconstrained cyclist who knows how to deal with traffic will want to move to the left of the through street before arriving at the intersection, while a cyclist constrained to the path will have to use the cross street for the entirety of the crossing. Even though the end result is the same, the authors’ procedure— to the extent that it actually works as claimed— would count injuries occurring in the first crossing manoeuvre against the through street, but not count any injuries from the second manoeuvre against the path, as they would have occurred along the cross street.
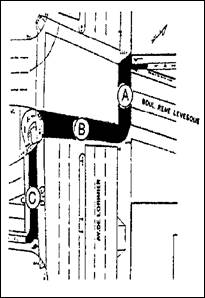
- The paths themselves occasionally cross from one side of the street to the other. For example, the René Lévesque path studied by the authors crosses from the south side to the north side precisely at the street chosen by the authors (de Lorimier) to terminate the path segment which they examined, thus excluding from their analysis all the resulting injuries (see Figure 14).
5 Inappropriate or missing statistical analysis
5.1 Confounding
Lusk et al. compared six paths with a total of eight reference streets, two of the intervention streets being compared with two reference streets each. They used MVO injury counts as an indicator of potential confounding, but performed no adjustment for the overall risk ratio because the overall average ratio of reference to intervention MVO injury counts was near 1. For unexplained reasons, they also performed no adjustments on the individual risk ratios.
The MVO injury ratios of the individual references to intervention comparisons are heterogeneous, varying by factors of up to 25. This seems to indicate only that the authors made a judicious selection of outliers to achieve the goal of a neutral average. Averaging selected outliers to arrive at an overall assessment is not a valid statistical procedure.
5.2 Effect modification
The authors averaged the risk ratios for the two-street comparisons to obtain a single risk ratio for those paths, and averaged all eight comparisons to provide a single risk ratio for the entire group. Pooling results in this way is invalid in the presence of effect modification.
The heterogeneous risk ratios obtained for the individual comparisons are standard evidence of effect modification. The authors provide no evidence or statistical tests to the contrary.
5.3 Poisson distribution
The authors calculate their confidence intervals under the assumption that the event probability follows a Poisson distribution. For a Poisson distribution to be a correct description, the variance must equal the mean, and the event probability must be constant per unit time. The authors provide no data on the variances for the reader to check, and provide no indication that they checked themselves. Given the tremendous changes in motor vehicle traffic flows and the cycling scene in Montreal over the decade of the study period, the assumption of time constancy also appears untenable.
Coincidentally, an article appearing in the same journal shortly after the work of Lusk et al. showed that the Poisson distribution is not a good fit for falls count data that might be analogous [[11]]
5.4 Construction of the reference and intervention samples
The authors state that the lengths of the path segments they studied “may be less tha[n] the entire cycle track length for comparability with reference streets.” This explanation is nonsensical for each and every reference-intervention pair, because in every case the comparison street continues far beyond any early termination point chosen by the authors.
Thus the authors provide no information on how the intervention sample was chosen – either the particular paths, or the start and end points of the segments actually studied. These choices are particularly crucial because the segments avoided several high-volume or otherwise hazardous intersections, such as:
· Papineau (one street after the early termination point) and Rachel;
· de Lorimier (the early termination point) and René Lévesque (see Figure 14);
· the continuation of the Brébeuf path at St Grégoire (the first intersection after the termination point);
· multiple further locations.
Since presumably the authors do not count incidents occurring to cyclists travelling along the path but in the terminating intersections, using short path segments as the authors do also lowers the overall number of intersections per kilometre, making for a comparison more favourable to the paths. (Example: for block lengths of 200 m, a 1 km path without the terminating intersections would have incidents resulting from 4 intersections per kilometre, while a 5 km stretch of the same path would have incidents resulting from 4.8 intersections per kilometre— a 20% increase.)
The authors also do not tell us why two particular paths and these only were chosen to have two comparison streets. The authors need to explain whether the choice to include any second comparison was made before or after data from any first comparison were obtained.
6 Incorrect representation of statistical results
The authors prominently state that “Cycle tracks lessen, or at least do not increase, crash and injury rates compared to bicycling in the street.” This is an incorrect representation of the authors’ results, for two reasons.
6.1 No crash data for comparison streets
First, the authors supply no crash data for their comparison streets, so there are no relevant study-specific results to support their crash claim. They can only make a non-statistical comparison to the few and divergent estimates that have previously made it into the literature, which are not always the same or higher than the ones obtained by the authors (the latter by an incorrect and also unsound calculation, as described previously in sections 1.1 and 1.3): as cited by Lusk et al., instead they range from approximately one-third to six times the ones the authors come up with.
Second, by making this same claim for the injury rates, for which they do have statistical results, they make a well-known elementary statistical error, namely confounding clinical or public health significance, and the facts of the matter as well, with statistical significance[[12]].)
In fact, out of eight comparisons, the authors found that in three of their decade-long cases the injury rate actually recorded was higher on the bicycle path than on the comparison street: respectively 1%, 18%, and 21% higher. That the authors found none of these figures to be statistically significant does not constitute an endorsement of the cycle paths, but rather a weakness of the authors' methods. Thus a major study of physically separated bicycle paths in Copenhagen[[13]] using methods superior to those of Lusk et al. found a statistically significant 12% increase in crash injuries after the installation of the paths, and a statistically significant 19% increase in injuries specifically to pedestrians, with the greatest burden of the increases being born by females. A further parsing of the data has found a 30% increase in the crash rate for cyclists[[14]].
6.2 Crash rates described as injury rates
The “What this study adds” box incorrectly compares the (incorrectly calculated, see sections 1.1 and 1.3) injury rate of 8.5 per km reported by the authors with a range of 3.75 to 67 supposedly reported elsewhere. In fact the latter figures are crash rates, not injury rates.
7 Body of literature that came to opposing conclusions
The authors provide a detailed criticism of a single study from 1994 that came to a conclusion opposed to theirs. They refer to a recent study of bicycle paths in Copenhagen[[15]] — much larger, more comprehensive and detailed than theirs, that used a study design superior to their own and that also came to opposing conclusions — only with the remark “conflicting studies with warnings of increased crash rates”.
. They omit all reference to the body of other literature, including further studies using methods superior to their own (e.g. before and after in combination with comparison streets), that also came to opposing conclusions. Overviews and examples of this literature can be found elsewhere [[16]] [[17]].
8 Drawing policy implications despite failure to consider the problem systemically
Lusk et al. provide no information on standard characteristics of their streets, disabling any assessment of generalizability. The authors’ study is unifactorial, considering only one aspect (ambulance calls) of harm only to cyclists. They consider no other possible harm, including harm to pedestrians, even though this and harm and inconvenience to other user groups have been found by larger studies using superior study designs [[18]] [[19]]. Nor did they consider costs or alternatives. Even discounting all the flaws with this study outlined in the preceding sections, to draw policy implications of any kind from such a limited basis is not serious[[20]] [[21]] [[22]].
It may be unfair, though, to blame the authors for this fault. “Implications for Policy” is a section specified by the journal, whose founding editor espoused a grandiose conception of epidemiology. Would the editors of Injury Prevention have accepted this article for publication if the correct policy implications were drawn, namely “none”?
9 Conclusion
The authors note that cycling on the paths is on average 2.5 times more popular than cycling on their comparison streets. It ought to be: the city has typically gone out of its way to select some combination of the most direct, the most convenient, the most scenic, the most pleasant, and sometimes even the safest routes. For their comparisons Lusk et al. selected streets featuring amongst other disadvantages some combination of higher speed limits, heavier and more chaotic traffic, less pleasant surroundings, less convenience, and more intersections than the intervention streets; and went up to 10 blocks out of the way to find them.
Lusk et al. began their article with an apparent truism, that most bicyclists would prefer to ride separated from motor vehicle traffic. They neglect that most motorists would also like to drive separated from other motor vehicle traffic, most bicyclists would prefer to ride separated from other bicyclists narrowly overtaking them from behind, blocking the way in front, wobbling around them, whizzing by immediately adjacent in the opposite direction, and likewise from rollerbladers, skateboarders, wheelchair users, electric scooter riders, baby-stroller joggers, pedestrians making the mad dash from the sidewalk to their parked cars on the other side of the path or lollygagging unpredictably immediately adjacent on the sidewalk. On the other hand, the pedestrians, especially the elderly, find the two-way traffic of the bicycle paths adjacent to the sidewalk difficult to contend with and hazardous (see Figure 4, Figure 13, and the associated captions). Meanwhile, on crowded sidewalks fast and slow walkers come into conflict (see Rohwedder (n.d.) [[23]], and on quiet ones both can get their nerves jangled by runners, who in turn have to weave around them, sometimes stepping into the roadway to do so. Even fast and slow runners on eight-lane purpose-built tracks tangle their rights of way, in both competition and training.
The authors’ vision is one where every user type is relegated to its own path and given its own signal at intersections. Unfortunately the more ways 100% is divided, the smaller everyone’s share becomes [[24]]. Already at an intersection with two equal rights of way, half the users must spend the signal cycle waiting; add just one more, and the duty cycles are reduced from one-half to one-third while two-thirds of the users must sit idle, the motorized among them spewing greenhouse gases all the while. If instead the cyclists’ green signal phase is made very short, noncompliance is promoted; while if turning motorists are required to yield to cyclists on their curb side, the result is delay and danger, as on de Maisonneuve[[25]].
Appendix 1: Tables
Table 1. Brébeuf path, Rachel to Laurier (Barrette)
|
|
Brébeuf (intervention) |
St Denis (used as comparison; located 10 blocks away from intervention street) |
Streets adjacent to Brébeuf: Chambord, de Lanaudière (not used by authors) |
|
Posted Speed Limit |
30 km/hr (typically respected) |
50 km/hr (routinely exceeded) |
40 km/hr |
|
Traffic Lanes |
1-2 |
2 North, 2 South |
1-2 |
|
Intersections per km |
5 |
6-7 (one an offset diagonal) |
5-6 |
|
Parking Lanes |
2 |
2 |
2 |
|
Comments |
Entirely residential, low traffic, no heavy vehicles or bus routes, one driveway (laneway) per block |
Heavily commercial, heavy traffic, heavy vehicles, bus routes, metered parking length of route, numerous places serving alcohol, narrow parking and first lanes; is also a numbered Quebec provincial highway (Route 335)[[26]] [[27]] (see also Brébeuf group photos in this document).
|
Essentially identical in character to intervention street |
Table 2. De Maisonneuve path, Claremont to Greene, two streets short of Wood.
(Authors claimed to have studied path from Claremont to Wood, but for almost the entirety of their study period the segment from Greene to Wood did not exist.)
|
|
de Maisonneuve (intervention) |
Sherbrooke (used as comparison) |
Ste Catherine (used as comparison) |
|
Approximate Length |
1.56 km |
1.59 km |
1.66 km |
|
Intersections |
9.0 |
12.6 |
11.4 |
|
Posted Speed Limit |
30 km/hr (typically respected) |
40 km/hr (routinely exceeded) |
30 km/hr (routinely exceeded) |
|
Traffic Lanes |
0-1 (one-way traffic) |
4-5 (two-way traffic) |
4-5 (two-way traffic) |
|
Parking Lanes |
0, or 1 on opposite side of street |
2 |
0-2 |
|
Comments |
Very low traffic, no major intersections, entirely residential, no heavy vehicles, motorcycles or bus routes, no metered parking (2-hour limit); no motor vehicle traffic through Westmount Park; signage for helmet use |
Heavy traffic, commercial activity, major intersections, numerous bus routes and heavy vehicles, narrow parking and adjacent travel lanes, some metered parking; no signage for helmet use |
Heavy traffic, commercial activity, major intersections (one at bottom of hill), numerous bus routes and heavy vehicles, some metered parking, one section divided four-lane with no parking; no signage for helmet use |
Table 3. Berri path, Viger to Cherrier
|
|
Berri (intervention) |
St Denis (used as comparison) |
|
Intersections |
3.6 |
7.9 |
|
Traffic Lanes |
2 North, 2 South, separated for much of length by raised medians or wide marking |
2-4 southbound only from Viger to Sherbrooke; 2 North, 2 South undivided from Sherbrooke to Cherrier |
|
Parking Lanes |
1 |
0-2 |
|
Comments |
Dominated by large institutions whose entrances on St Denis tend to route cross traffic away; underpass avoids major intersection at Sherbrooke; relatively simple overall traffic flow. Has second and third-worst bicycle injury blackspots of entire island of Montreal (intersections at Viger and Ontario). |
Part heavily commercial, with metered parking, numerous places serving alcohol; part dominated by heavy traffic to major institutions, including emergency room entrance to major hospital; no underpass at Sherbrooke; chaotic traffic flow. Authors index this street as being safer for cyclists than Berri, for having had a lower MVO injury count. |
Table 4. Christophe Colomb path, Jarry to Gouin
|
|
Christophe Colomb |
St Hubert (used as comparison; |
|
Approximate length |
3.7 km as given by Lusk et al. (in part curved) |
3.52 km as measured from map (shorter because straight) |
|
Intersections |
3.2 |
4.5 |
|
Posted Speed Limit |
40-50 km/hr |
50 km/hr |
|
Traffic Lanes |
0-5, in parts divided northbound/southbound by raised median |
2-5 |
|
Parking Lanes |
0-2 |
0-2; AM & PM rush hours, alternates between east and west side |
|
Comments |
Approximately one-third of segment is through a park or park-like setting, rest is mostly residential on at least the path side. |
This route is hardly used by bicyclists. The few riders and injuries recorded may be from only a limited subsection, or mainly represent local children riding on the sidewalk. Other section of Christophe Colomb used as second comparison may similarly have counted mostly sidewalk riding. |
Table 5. Rachel vs. Mont-Royal
(One example of the three cases where the non-intervention street had a better record (path street had 18% higher injury rate over the decade of the study period)
|
|
Rachel (intervention) |
Mont-Royal (used as comparison) |
|
Bus Routes |
1 |
2-3 |
|
Subway Stations |
0 |
1 at middle of segment |
|
Lanes |
Wider |
Narrower |
|
Traffic Intensity |
Lighter |
Heavier |
|
Eastern End |
Residential area, parallel to a large park discouraging or blocking cross traffic |
Heavily commercial area with northbound and southbound cross traffic |
|
Western End |
Rachel terminates as a dead end at a park approximately 75 m after St. Urbain boundary |
Becomes major multi-lane road feeding from/to large complex of multiple major arteries, the worst cycling injury hotspot on the entire island of Montreal (see photos). Authors index this street as being safer for cyclists than Rachel, for having had a lower MVO injury count. Motor vehicle traffic is often gridlocked, with few possibilities for injury to motorists, but many to bicyclists. |
Appendix 2: Photos
de Maisonneuve group photos
Figure 1: de Maisonneuve at Clarke
(A) de Maisonneuve at Clarke, looking to the
southwest: one-way through
unproblematic, low-speed, low-traffic intersection. Google satellite
view.
(B) Signage for compulsory helmet use on path
(“casque obligatoire” sign at
upper left). Also note that the path is legally open to skaters. Google
Street View.
(C) Ste Catherine at Clarke, looking east:
two-way through problematic
multi-lane high-traffic intersection. No helmet signage. Google
satellite view.
(D)Sherbrooke at Clarke: two-way through
another problematic high-traffic
intersection. No helmet signage. Google satellite
view.
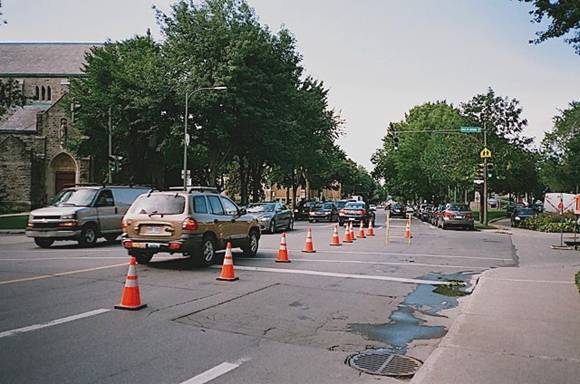
Figure 2: de Maisonneuve at Claremont
(A) At the Do Not Enter sign, southwest end of de Maisonneuve-Clarke path: residential, low traffic, one-way. Claremont (left); Ste Catherine (right), not parallel here, but a high-traffic two-way 4-lane divided street running south and then turning east. Google satellite view.
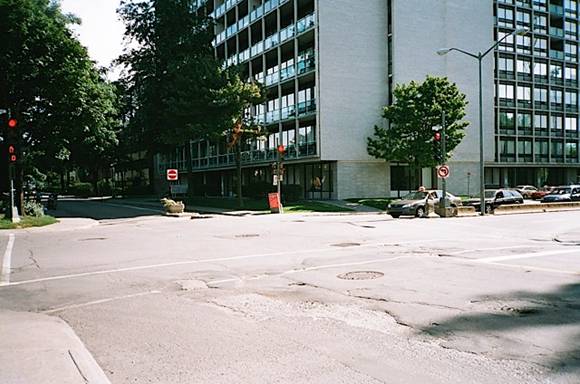
(B) Sherbrooke at Claremont: commercial, high volume two-way traffic. Google satellite view.
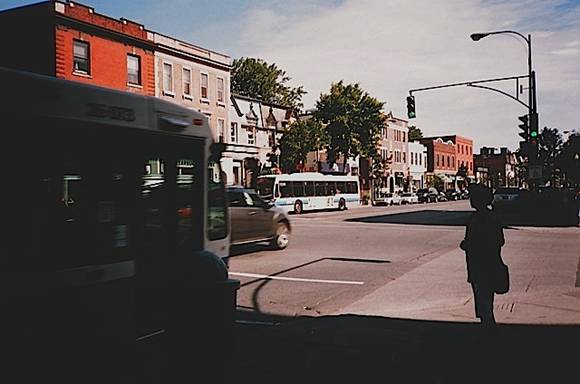
Figure 3: de Maisonneuve at Lansdowne
(A) de Maisonneuve at Lansdowne, facing
east. Road comes from
a dead end at the park in the background. Google
satellite view.
(B) Ste Catherine at Lansdowne, facing southwest:
major intersection at bottom of hill.
Google satellite view.
(C) Sherbrooke at Lansdowne, facing east: another high-volume intersection. Note non-standard, narrow parking and first traffic lanes. Google satellite view.
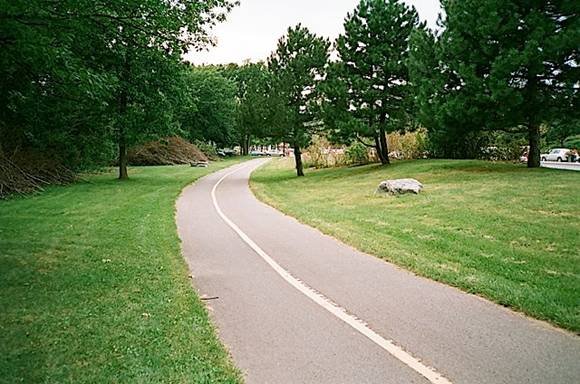
(D) de Maisonneuve path in Westmount Park, east of Lansdowne, facing west: no street and no intersections. Google satellite view.
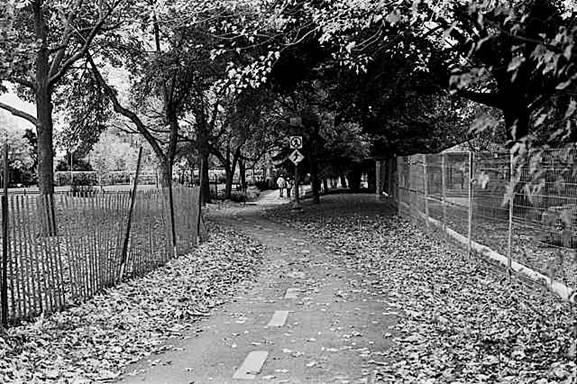
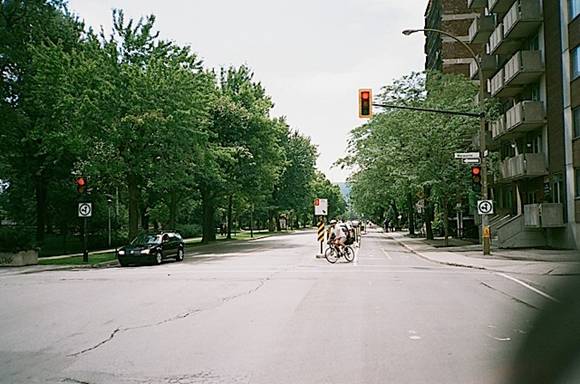
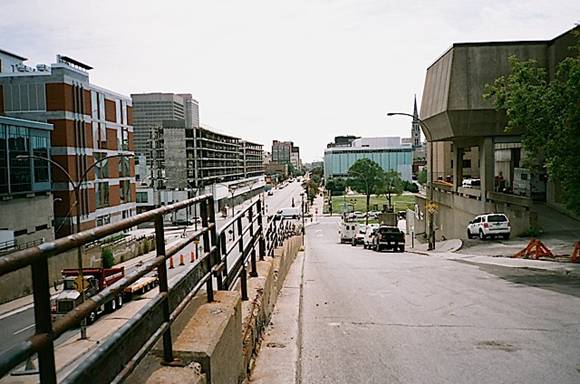
Figure 4: de Maisonneuve downtown section
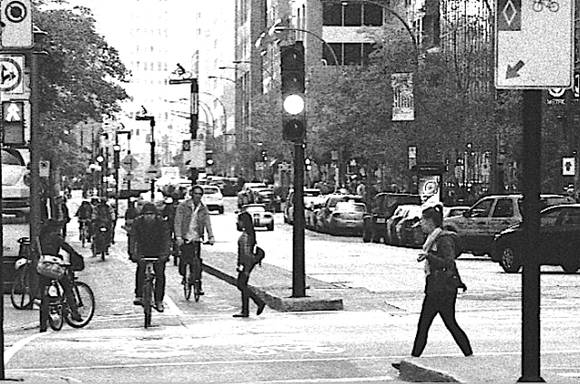
de Maisonneuve path at University, in a section not studied by the authors: the reality of a downtown bicycle path in Montreal, or anywhere. Path is two-way, not one way or arbitrary way, as its users seem to indicate in this photo. The authors count only injuries to cyclists, omitting those to pedestrians. Also see video of a ride on this path[[28]] , and a survey of the path as it existed in 2009-2010 [[29]]. Google Street View.
Christophe Colomb group photos
Figure 5: Christophe Colomb at Jarry
(A) Christophe Colomb at Jarry, facing north. After the gas station, the neighbourhood is residential on the path side, until the elevated expressway in the background, where the intersection is the fourth-worst bicycle injury blackspot on the island of Montreal. Three of the island’s four worst are on the cycle paths. During the authors’ study period, this section of the path was instead on the sidewalk, which was of a different width and construction at the time. Google satellite view.
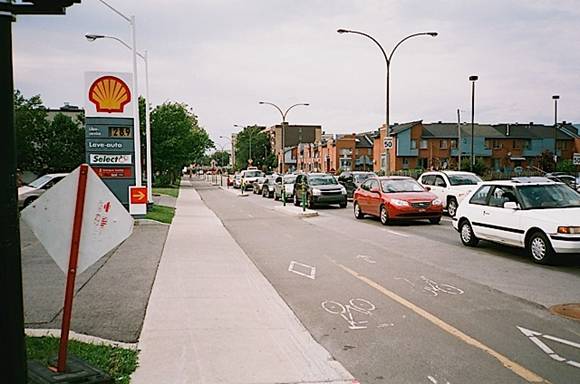
(B) St Hubert at Jarry, facing north. Neighbourhood is commercial. Google satellite view.
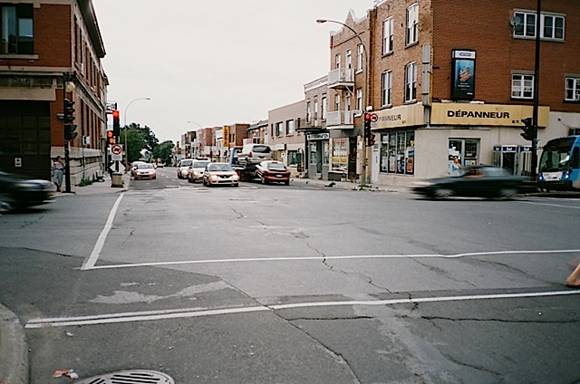
Figure 6: Christoph Colomb at and near Émile Journault
(Also see Google satellite view.)
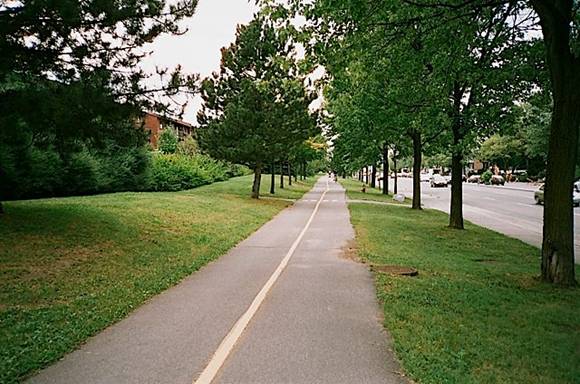
(A) Christophe Colomb a short distance north of Émile Journault, facing north. The authors describe this as sidewalk level, separated from traffic by the curb and a “planting strip”.
(B) Further north, facing north. Parallel sidewalk is separate and to the right. Crossing path is a footpath.
 >
>
Figure 7: Christoph Colomb at Fleury
(A) Christophe Colomb at Fleury, facing westnorthwest. Google satellite view.
(B) St Hubert facing north toward Fleury.
No-parking side alternates morning and afternoon rush hours. Rush hour side
appears suitable for bicycling, but at times of heavy traffic, two cars drive side by side (this is the
purpose of the parking change). A bicyclist must either ride in line with motor
traffic, which few are willing to do; use the sidewalk; or invite serious
injury by riding adjacent to traffic. The solution most bicyclists adopt is to
not use this route.
Google Street View.
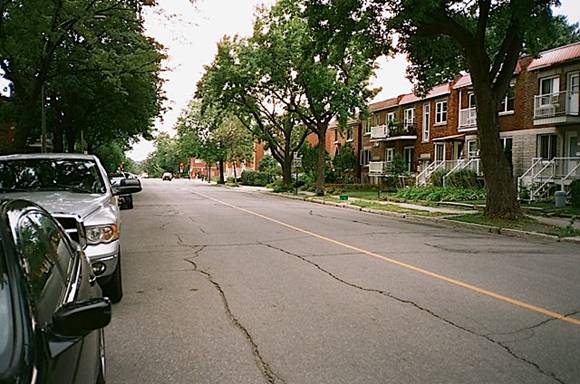
Figure 8: Christophe Colomb at Gouin
(A) Northern end of Christophe Colomb path at Gouin, facing south. Google Street View. {Note: end of path has been moved to the other entrance from Christophe Colomb since the photo and Street View were made.).
(B) Northern end of comparison street St
Hubert at Gouin, facing south. The authors describe St Hubert as being safer
for for cyclists than Christophe Colomb, on the basis of a lower MVO injury count.
Google Street View.
(C) Comparison street St Hubert, the closest
parallel street which also crosses the expressway (overpass visible in
background), facing east. No parking on the right during morning rush hour.
Google Street View.
Rachel group photos
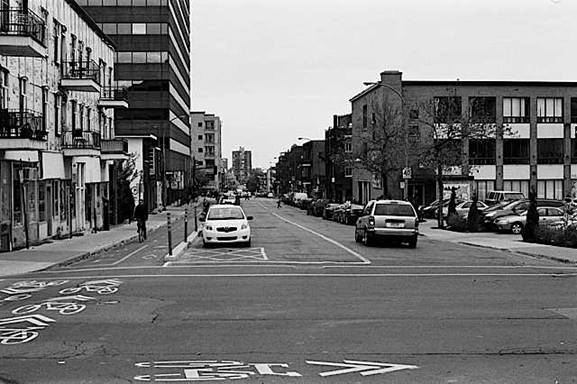
(A)Rachel at St Urbain, facing southwest:
terminates at a T intersection.
Google satellite view.
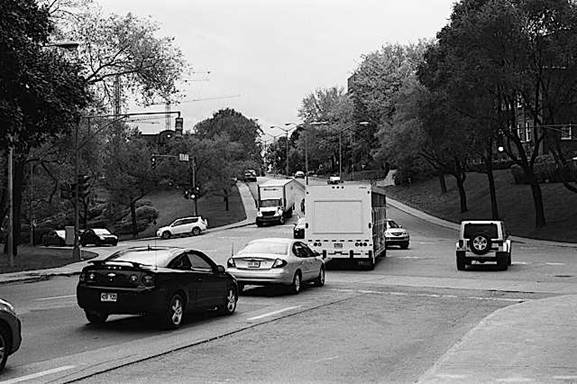
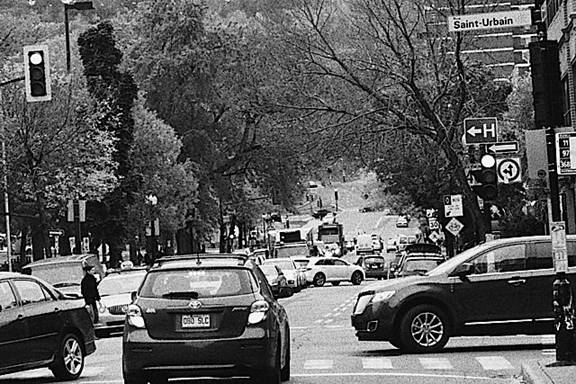
(B) Mont-Royal at St Urbain, facing southwest:
feeds to/from a major multi-way intersection complex, the worst bicycling
injury blackspot on the entire island of Montreal.
Google satellite view.
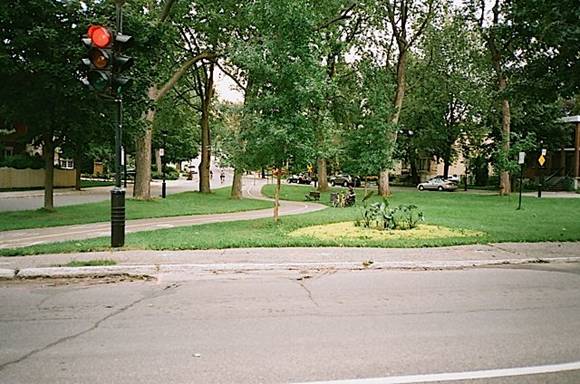
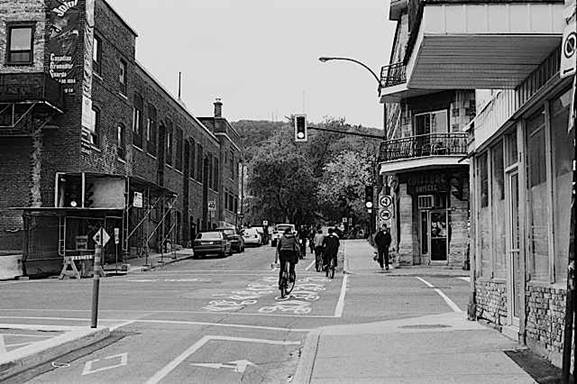
(C) Rachel at St Urbain, facing east: traffic so light that the photographer can stand in the middle of the street without major concern. Google street view.
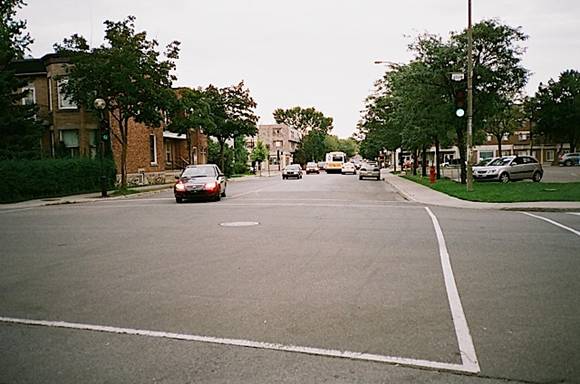
(D) Mont-Royal at St Urbain, facing east: photographer did not stand in the middle of the street. Time difference between this photo and the one in Figure 7C: about 5 minutes, the time it took to walk from one to the other. The authors describe Mont-Royal as safer for cyclists than Rachel, on the basis of lower MVO injury counts. Google street view.
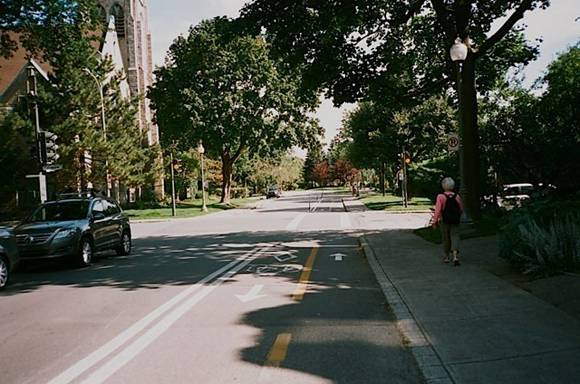
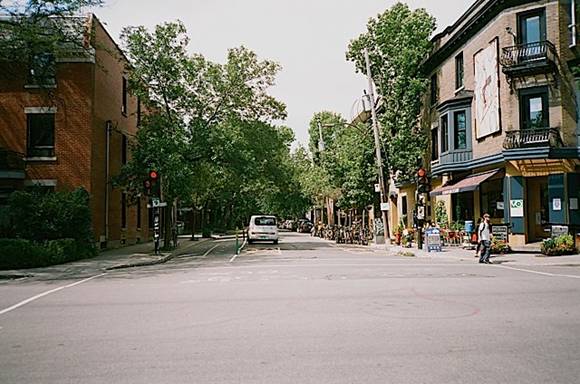
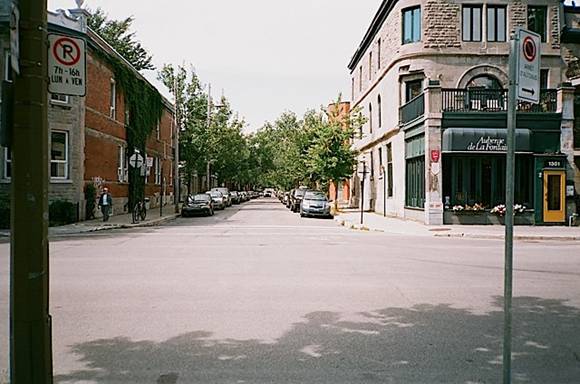
(E) Rachel at Marquette, facing southwest. Lafontaine Park to the south blocks or discourages crossing traffic along most of its width. Google street view.
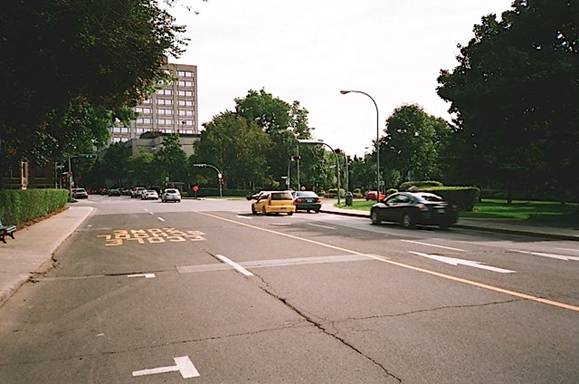
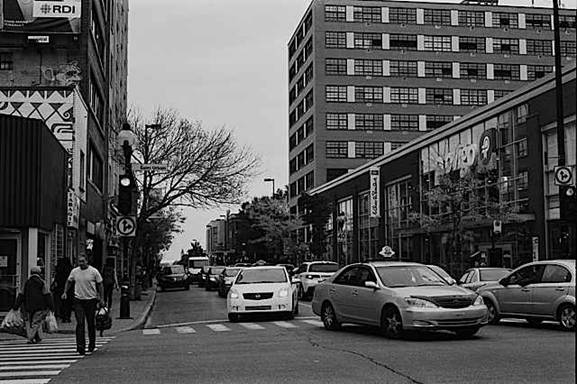
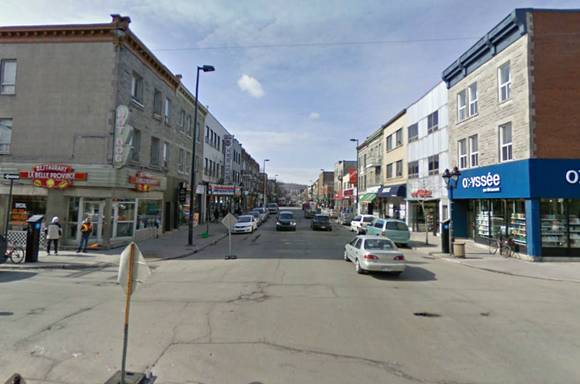
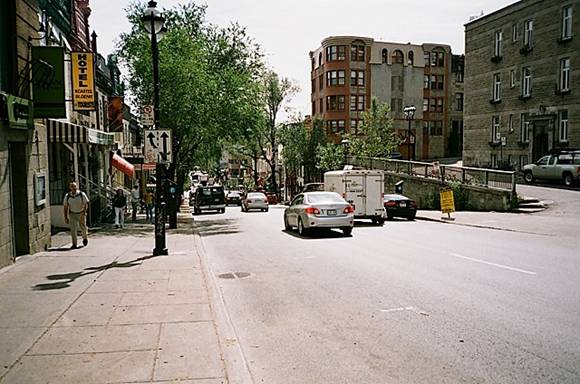
(F) Comparison street Mont-Royal at Marquette
is in a heavily commercial area. As of 2011 there is a fast-food restaurant on
each corner. This is a Google Street View image looking southwest.
Google satellite view.
Berri group photos
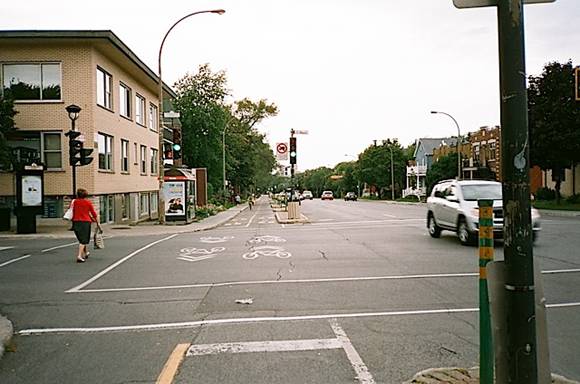
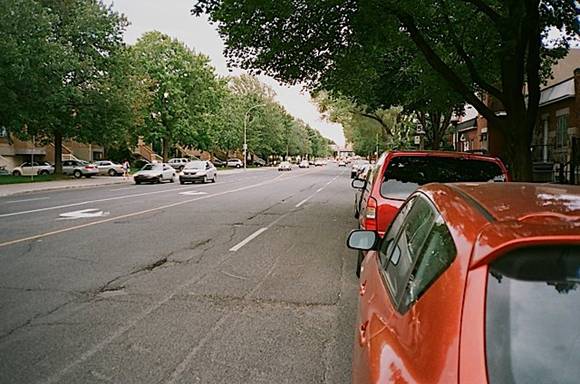
(A) Berri at Viger, facing north. Mostly residential on path side in this area. Northbound side of roadway divided from southbound by raised medians at intersections and wide markings in between. Google satellite view.
(B) St Denis at Viger, facing north. Traffic lanes all one-way southbound. Large building in background is a major hospital, whose emergency room entrance is on St Denis, adjacent bicycle traffic keeping to the right in the direction of traffic flow. Google satellite view.
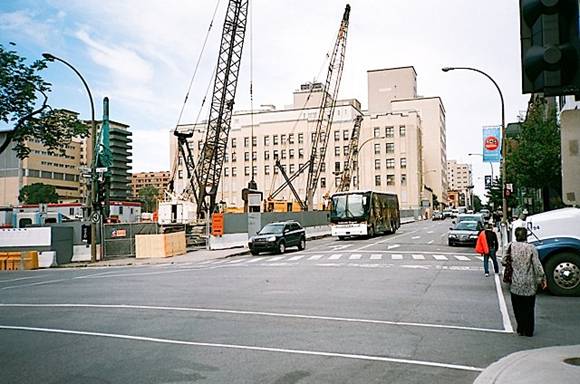
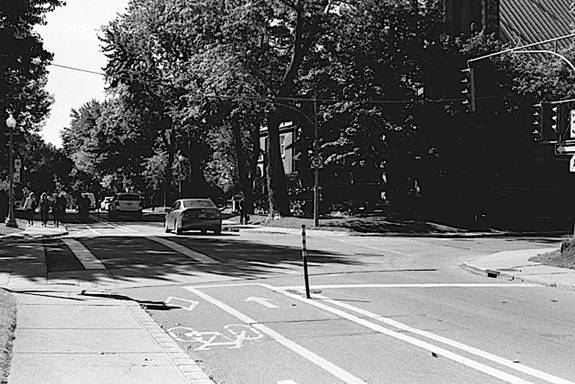
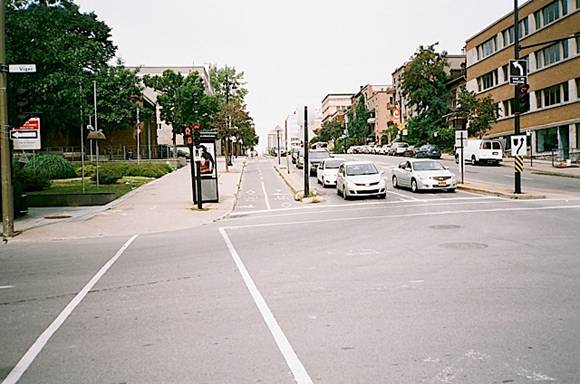
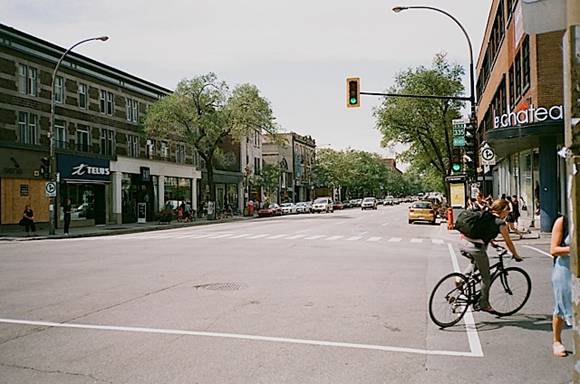
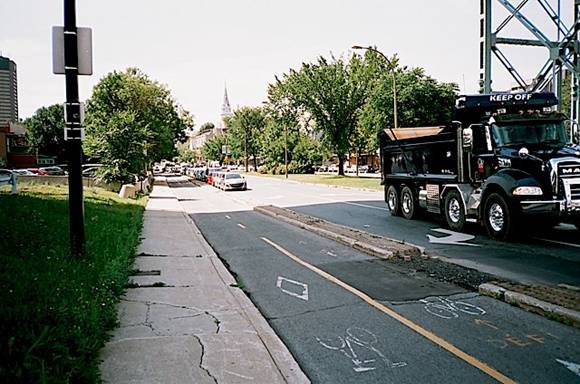
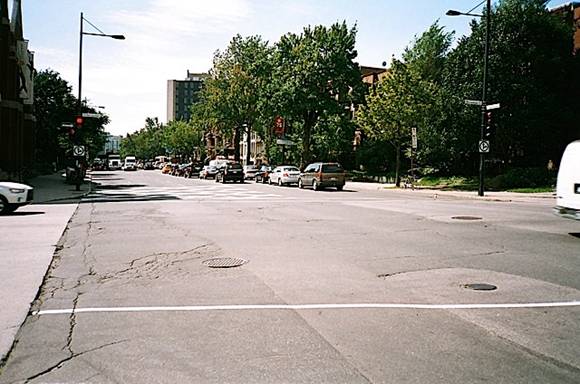
Figure 11: Berri at Sherbrooke and Ontario
(A) Overlooking Berri, just below Sherbrooke,
facing south. Underpass bypasses major intersection at Sherbrooke. North and
southbound lanes of roadway separated by raised median; path is on the
west-side sidewalk. First cross street is Ontario[[30]], whose intersection with this path, along with Viger and this path,
are the second and third worst bicycle injury blackspots on the entire island
of Montreal. Also see video of a ride through this section.[[31]]
Google satellite view.
(B) St Denis at Sherbrooke, facing south: thoroughly different in
character.
Google satellite view.
Brébeuf group photos (all facing north)
(A) Brébeuf at Rachel. Google satellite view.
(B) Almost identical adjacent street Chambord
at Rachel:
not used by authors for comparison. Google satellite
view.
(C) Almost identical adjacent street Lanaudière at Rachel:
not used by authors for comparison. Google satellite view.
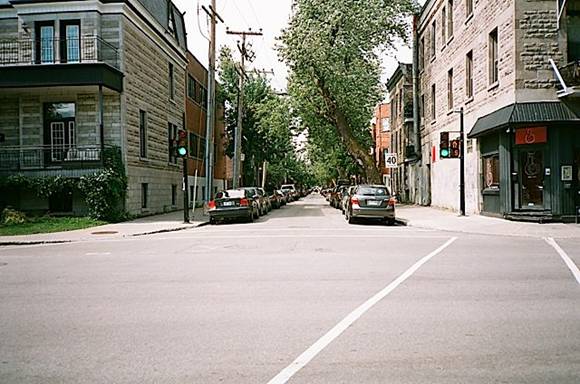
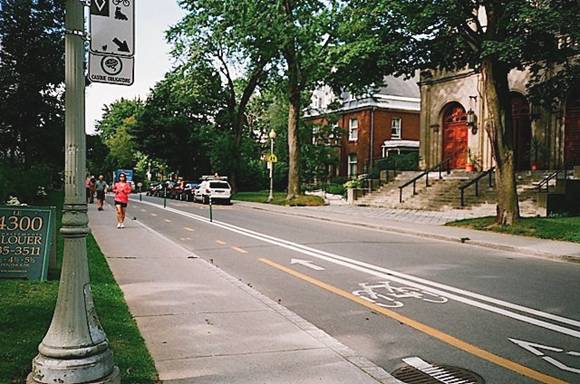
(D) St Denis at Rachel: 10 blocks away, thoroughly different in character; chosen by the authors for the comparison. Note signage as a numbered Quebec provincial highway [[32]](Route 335) [[33]] . Google satellite view.
René Lévesque group photos
Figure 13: René Lévesque at Maison Radio-Canada
Réne Lévesque
facing east, in the authors’ path segment. Building at right is the Montreal
headquarters of the Canadian Broadcasting Corporation. Bridge in the background
is de Lorimier. In 1990. renowned CBC
journalist and producer Joan Donaldson[[34]] attempted to
cross this two-way path to get a taxi, and was struck down by a cyclist coming
from her right. She remained in a coma for at least six months, could not speak
at all for three years, and was
left permanently brain-damaged and quadriplegic[[35]]. The cyclist was
uninjured. Donaldson died in 2006 from extended complications of the accident.
Authors’ method does not count such injuries, for not being to a cyclist.
Google
satellite view.
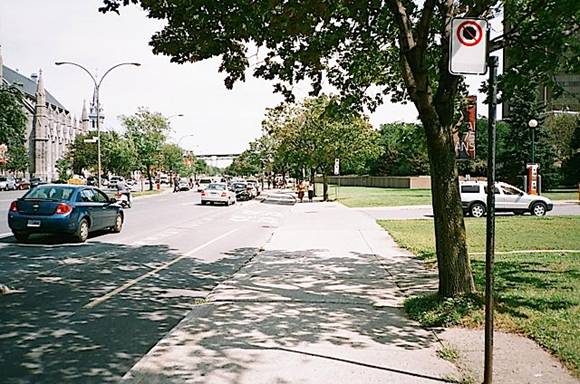
Figure 14: René Lévesque at de Lorimier
|
(A) Route which bicyclists are directed to follow through the complicated intersection of René Lévesque at de Lorimier, requiring a sequence of three crossings during different traffic-signal phases[[36]]. North is at the upper right in the map. The street corner at the upper right is in the foreground of the photo below. In the next photo, the camera location is at the lower leftt of the map, and the camera points to the west (to the left, off the map), away from the intersection. The crossings were once marked with blue paint, but as of 2011 it had largely worn away. Google satellite view. |
|
(B)René Lévesque at de Lorimier, facing west. Path switches from north to south side; any resulting injuries excluded by the authors. Heavy bridge traffic neither enters from nor exits to René Lévesque, but instead feeds to and from the comparison street, Sherbrooke. Google Street View.
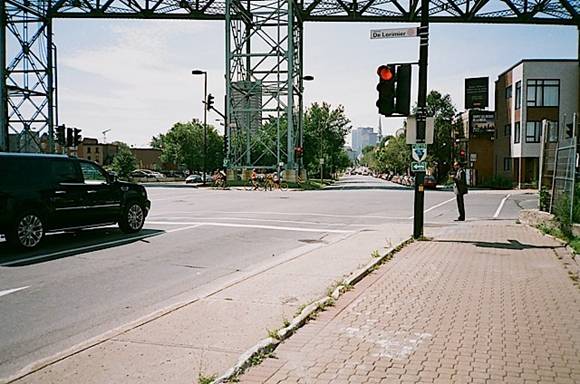
C) Réne Lévesque at the eastern start of the authors’ path segment looking from de Lorimier facing west, omitting the dangerous de Lorimier intersection. Geography of the area makes for few opportunities for cross-traffic. Google Street View.
Note: Google Street Views show that the bikeway on the south side of René Levesque west of de Lorimier was removed sometime between September 2011 and May 2014 and replaced by one on the north side, requiring only a single crosswalk to connect with the bikeway on the other side of de Lorimier. The bikeway crosses to the south side at an intersection with a small street, Rue Cartier, west of de Lorimier.
(D) Sherbrooke at de Lorimier: crossed by
many major north-south routes.
Google
satellite view.
[1] Lusk, A. C., Furth, P. G., Morency, P., Miranda-Moreno, L. F., Willett, W., & Dennerlein, J. T. (n.d.). Risk of injury for bicycling on cycle tracks versus in the street. Inj Prev doi: 10.1136/ip.2010.028696, ip.2010.028696. Retrieved May 1, 2012 from http://injuryprevention.bmj.com/content/early/2011/02/02/ip.2010.028696.full.
[2] Kary, M. (2011). Compendium of errors and omissions, or: What is not in this article. Retrieved May 22, 2012 from http://john-s-allen.com/pdfs/Errors%26OmissionsLuskEtAl-1-Ac6.pdf
[5] Miranda-Moreno, L. F., & Nosal, T. (n.d.). Weather or not to cycle; whether or not cyclist ridership has grown: a look at weather's impact on cycling facilities and temporal trends in an urban environment. Retrieved August 27, 2011 from https://trid.trb.org/View/1092408
[6] Pein, W. (n.d.). Critique of: "Risk of Injury for Bicycling on Cycle Tracks Versus in the Street". Abstract retrieved May 1, 2012 from https://web.archive.org/web/20160307091749/https://injuryprevention.bmj.com/content/17/2/131/reply#injuryprev_el_2789. Complete report retrieved August 26, 2011 from https://bicyclingmatters.wordpress.com/critiques/montreal-cycle-tracks.
[7] See Google satellite view, https://maps.app.goo.gl/QtkDnSJvoQtgv9Bc7
[8] Régie Régionale de la Santé et des Services Régionaux. (n.d.). Réseau. Retrieved April 26, 2012 from http://web.archive.org/web/20030608152223/http://www.stcum.qc.ca/info/reseau2003.pdf
[11] Khan, A., Ullah, S., & Nitz, J. (2011). Statistical modelling of falls count data with excess zeros. Injury Prevention, 17, 266-270. Abstract retrieved May 1, 2012 from http://injuryprevention.bmj.com/content/17/4/266.abstract
[12] Sterne, J. A., & Smith, G. D. (2001). Sifting the evidence— what's wrong with significance tests? BMJ, 322, 226–31. Abstract retrieved May 1, 2012 from http://www.bmj.com//content/322/7280/226.1.
[13] Jensen, S. U. (2007). Bicycle tracks and lanes: a before-after study. 2007. Retrieved June 15, 2025 from https://web.archive.org/web/20180612141426/http://www.trafitec.dk/sites/default/files/publications/bicycle%20tracks%20and%20lanes.pdf
[14] Gutierrez, Daniel, Copenhagen Cycle Track and Bike Lane Study, retrieved May 1, 2012 from http://www.facebook.com/media/set/?set=a.1422969945625.54796.1574017310&l=6d6baf5bf4 [No longer online and not archived as of June, 2025]
[16] Erke, A., & Elvik, R. (2007). Making Vision Zero real: Preventing pedestrian accidents and making them less severe. Institute of Transport Economics, Norwegian Centre for Transport Research. Retrieved May 1, 2012 from https://web.archive.org/web/20120807223722/https://www.toi.no/getfile.php/Publikasjoner/T%D8I%20rapporter/2007/889-2007/889-2007-nett.pdf
[17] Agerholm, N., Casperson, S., & Lahrmann, H. (n.d.). Traffic safety on bicycle paths: results from a new large scale Danish study. Retrieved July 23, 2009, from http://vbn.aau.dk/files/14344951/agerholm_et_al._bicycle_paths.pdf
[20] Cummings P. Policy recommendations in the discussion section of a research article. Injury Prevention 2007;13:4–5. doi: 10.1136/ip.2007.015156. Abstract retrieved May 17, 2012 from https://pmc.ncbi.nlm.nih.gov/articles/PMC2610554/.
[21] Our policy on policy (editorial). Epidemiology 2001;12(4):371-372. Retrieved June 16, 2025 from http://journals.lww.com/epidem/Fulltext/2001/07000/Our_Policy_on_Policy.1.aspx
[22] Rothman KJ. Policy recommendations in Epidemiology research papers. Epidemiology 1993; 4:94-95.Retrieved June 15, 2025 from https://www.rti.org/publication/policy-recommendations-epidemiology-research-papers
[23] Rohwedder, C. (n.d.). Londoners Take Aim at Scourge of the Sidewalks— Slowpokes: Group Plans Lane for Hurried Walkers, But It Tiptoes Around Tourists' Feelings. Retrieved 2011from http://online.wsj.com/article/SB10001424052748704164004575547701061890026.html
[24] Forester, J. (n.d.). Review of the Cycling Aspects of: Making Walking & Cycling Safer: Lessons from Europe. Retrieved July 23, 2009, from: https://web.archive.org/web/20161104080232/http://www.johnforester.com/Articles/Facilities/Pucher%20Revs.htm
[25] Allen, J.: photo of yield sign on Maisonneuve (2008), retrieved May 1, 2012 from http://john-s-allen.com/galleries/Quebec/Montreal/slides/IMG_4458priorite.html
[26] Wikipedia. (2011, October 24). Quebec_Route_335. Retrieved May 1, 2012 from http://en.wikipedia.org/wiki/Quebec_Route_335
[27] Wikipedia. (n.d.). List of Quebec regional highways. Retrieved June 16, 2025 from http://en.wikipedia.org/wiki/List_of_Quebec_provincial_highways
[28] Allen, J. (2008, June 5). Bicycling on the Boulevard de Maisonneuve, Montreal, Quebec, Canada. Retrieved April 26, 2012, from http://www.youtube.com/watch?v=zsSm4RkplSY&hd=1
[29] Allen, J. (2011, September 7). A Second Look at the Boulevard de Maisonneuve. Retrieved April 28, 2012 from http://john-s-allen.com/blog/?p=3518
[30] Allen, J., photos of the underpass at Sherbrooke and of the intersection of Berri and Ontario (1992, 2008): retrieved May 1, 2012 from http://john-s-allen.com/galleries/Quebec/Montreal/slides/9305N14R06Montreal.html (this and two following photos in online album).
[31] Allen, J., Riding the Rue Berri sidepath in Montreal. (2008, June 5). Retrieved May 1, 2012 from http://www.youtube.com/watch?v=Ze7EXbWHRXM
[34] Canadian Broadcasting Corporation. (n.d.). About Joan Donaldson. Retrieved June 16, 2025 from https://web.archive.org/web/20161229234706/http://www.cbc.ca/joandonaldsonscholars/about-joan-donaldson.html
[35] Sherman, G. (n.d.). Joan's Story. Retrieved April 26, 2012 from http://www.geraldinesherman.com/JoanDonaldson.html
[36] Pronovost, J. F., & Lusignan, M. (1996). Behavior of Road Users Following the Application of a Special Bikeway Crossing Marking. Resource Book, 1996 Pro-Bike/Pro-Walk Conference (pp. 48-51). Portland, Maine: National Center for Bicycling and Walking. Cited in: Hunter, W., Harkey, D., Stewart, J. R. and Birk, M., Evaluation of the Blue Bike Lane treatment Used in Conflicts Areas in Portland, Oregon. Retrieved May 1, 2012 from http://john-s-allen.com/reports/Bluelane1fhwa.pdf