This post is about the intersection of Commonwealth Avenue eastbound and Charlesgate East in Boston, Massachusetts, an intersection with a “bike box” — a waiting area for bicyclists downstream of where motorists stop for traffic signals. More generally, this post is about the assumptions underlying the bike-box treatment, and how well actual behavior reflects those assumptions.
I have described bike boxes more generally on a Web page. There is a discussion of them also in photos assembled by Dan Gutierrez. If you are logged into facebook, you can bring up the first photo and click through the others (“Next” at upper right). [No longer online and not archived]
Dan Gutierrez has also released videos of bike box behavior here and here. [No longer online and not archived]
On Wednesday, September 19, 2012, I rode my bicycle to Charlesgate (see Google satellite view for location), with video cameras. I observed traffic for about an hour and shot clips of bicyclists passing through the intersection.
The bike box at this intersection is intended to enable a transition from the right side to the left side of a one-way roadway. (There is a study of a similar treatment in Eugene, Oregon, intended to enable transition from left to right. That study was released in two different versions, one from the U. S. Federal Highway Administration and another from the Transportation Research Board.)
I have now produced a video from my clips. Please view the video in connection with this article. You may view it at higher resolution on the vimeo site by clicking on the title underneath.
Bike Box at Charlesgate East from John Allen on Vimeo.
A Look at the Intersection
Let’s take a virtual tour, examining a longer stretch of Commonwealth Avenue than the video does.
West of Charlesgate West on Commonwealth Avenue, there is a bike lane in the car-door zone, tapering down to nothing before the intersection with Charlesgate West. Bicyclists can still slip by on the right side of most motor vehicles.
At some time following the initial installation, the City painted shared-lane markings near the right side of the rightmost travel lane. I have observed bicyclists riding at speed in the slot between the parked and moving vehicles, at risk of opening car doors, walk-outs, merges from both sides and right-hook collisions. The purpose of shared-lane markings is to indicate that a lane should be shared head to tail, not side by side. These markings should be placed in the middle of a lane rather than at its edge.
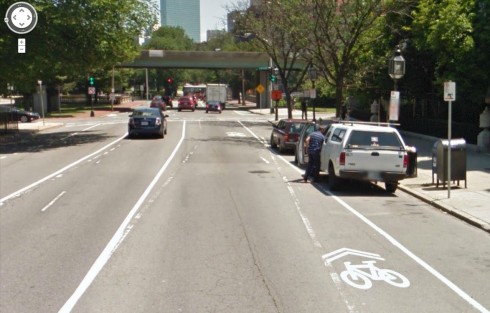
Between Charlesgate West and Charlesgate East, parking is prohibited, and the curb line at the right edge is farther to the right. The rightmost lane used to be a wide, general purpose travel lane — but nobody who knew the intersection drove a motor vehicle in this lane. A motorist who drove in this lane would be trapped to the right of other through traffic when it became a parking lane after Charlesgate East.
In or around 2010, bike lanes and a so-called “bike box” were installed at Charlesgate East.
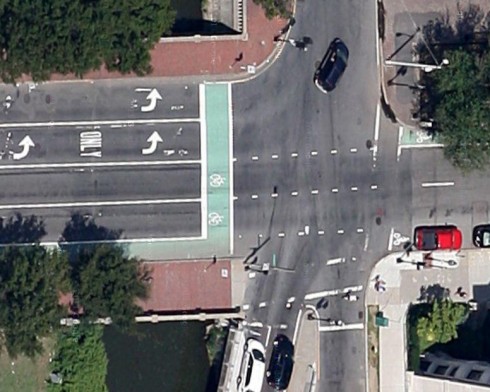
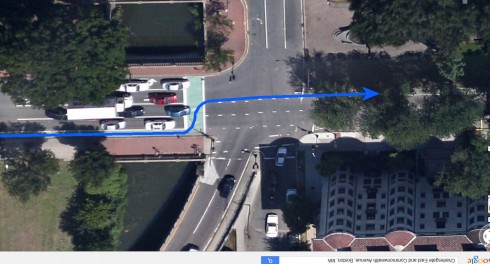
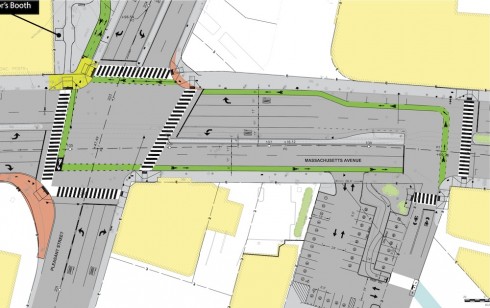
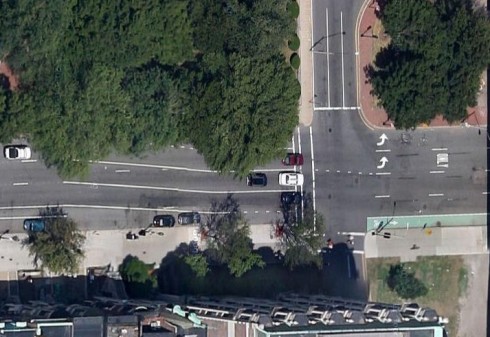
The intersection with Charlesgate East as it existed before 2010 is shown in the first of the two photos below. The intersection with changes is shown in the second photo.
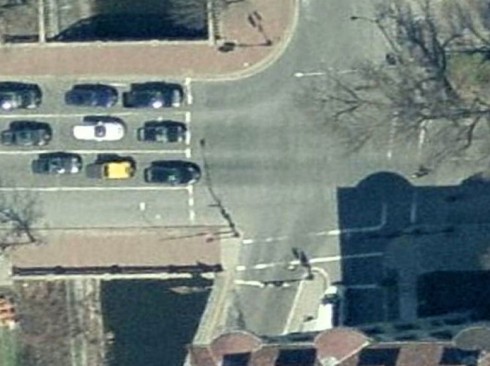
Following the changes at Charlesgate East: four usable travel lanes, and a musical chairs bike lane. Also note left-side bike lane after the intersection, top right corner of image. (Google Maps aerial view)
A bike lane is on the left side of the roadway (upper right in the photo above) leads to an underpass. The transition from the right side to the left side is supposed to be made by way of the “bike box”, with bicyclists swerving left across two lanes of motor traffic to wait facing the left-side bike lane as shown in the image below. Bicyclists headed for other destinations are also supposed to use the “bike box,” waiting in the appropriate lane.
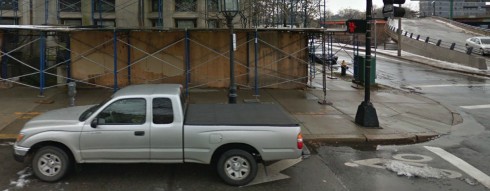
The right-side bike lane is now the “musical chairs” lane which leads into a parking lane. The City has, in a peculiar way, acknowledged this, painting what I call a “desperation arrow” just after the intersection. It is visible at the right in the photo below. It directs bicyclists to swerve into the right-hand travel lane in the short distance before the first parked car.
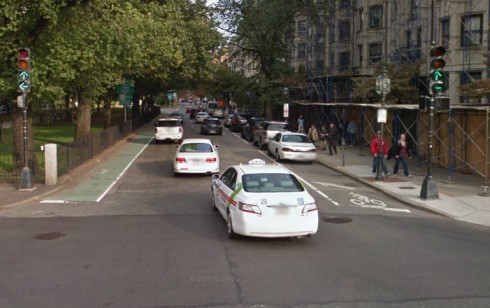
When the closest metered parking spot to the intersection is occupied, the parked vehicle sits directly over the “desperation arrow”.
The designated route is not the only important one. The left-side bike lane after the intersection reduces the width of the other lanes — a particular problem for bicyclists who continue in the rightmost travel lane. Many do, in order to continue at street level rather than using the underpass.
Bicyclist Behavior
I observed that most bicyclists approached Charlesgate East in the green-painted bike lane. It is the prescribed approach to the intersection, even though it is not satisfactory for any destination.
On reaching the intersection, many bicyclists ran the red light, yielding to cross traffic. In this way, they avoided being trapped to the right of moving motor traffic. Cross traffic was easily visible and relatively light, at least in mid-afternoon when I observed it.
The bike box can serve as a waiting area only on the red light. Approaching the intersection as the light turns from red to green or on the green requires bicyclists to merge left; otherwise, they are blocked by the parked cars on the far side of the intersection.
After crossing the intersection, most bicyclists merged into the door zone of the parked vehicles in the next block. If they did this on the green, they were at the same time being overtaken by motorists. Some bicyclists looked over their left shoulder for traffic as they merged; others did not.
I saw a couple of very odd maneuvers: two bicyclists who entered on the red light and crossed from right to left in the middle of the intersection as if that were the location of the bike box — one of these bicyclists continuing in the left side bike lane, the other merging back to the right. I saw one bicyclist who made a sweeping left turn from the bike lane.
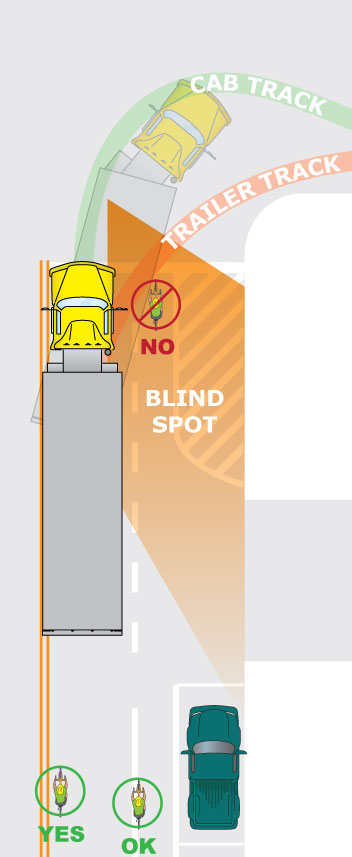
I did not see even one bicyclist swerving into the bike box as intended. This observation is consistent with Dill and Monsere’s research in Portland, Oregon. To swerve into the bike box when the traffic signal is red is to gamble on when the light will turn green, crossing close to the front of motor vehicles whose drivers are in all likelihood looking ahead at the traffic signal. A tall vehicle in the near lane can hide a bicyclist from a driver in the next lane. Often, also, motor vehicles encroach into the “bike box”, making it difficult or impossible to enter. Those bicyclists who knew about the underpass — and chose it — merged across easily if they ran the red light, but got caught waiting at the desperation arrow, if they entered on the green light.
A few bicyclists merged out of the bike lane before reaching the intersection. Some of these, too, ran the red light, and others waited for the green. It should be noted that there are long periods in the traffic signal cycle when the block between Charlesgate East and Charlesgate West is mostly empty, making merging easy.
Improve the Situation?
So, what does this show? For me, the central lesson of all this is that the bike box is supposed to solve a problem which it cannot solve.
Also, because entering the bike box is a gamble, it is a violation of traffic law. Massachusetts General Laws, Chapter 89, section 4A, states:
When any way has been divided into lanes, the driver of a vehicle shall so drive that the vehicle shall be entirely within a single lane, and he shall not move from the lane in which he is driving until he has first ascertained if such movement can be made with safety.
I’m especially concerned about bicyclists who lack basic bike handling and traffic skills being dropped into this environment which claims to remove the need for those skills but which in reality requires outsmarting the system. This leads to hazardous behavior and fear.
What could improve the situation here? I see parking as a crucial issue. Removing the 20 or so parking spaces in the block following Charlesgate East would cure the “musical chairs” situation at the intersection — well, mostly.
Vehicles would still stop to load and unload. There is no way that bicyclists can ride safely without knowing how to negotiate merges. Wherever bicyclists may travel, someone may be about to overtake. Removal of parking is a political long shot, to be sure, but on the other hand, the few parking spaces on Massachusetts Avenue can only hold a small percentage of the vehicles of people who live or work in the same block. Isn’t there a possible alternate parking location?
Improved traffic-signal timing might ease merging from the right side to the left side of the roadway in the block before Charlesgate East. Wayfinding signs and markings encouraging merging before reaching the intersection would be helpful.
In my video, I show bicyclists crossing Charlesgate East in a crosswalk. That is not to operate as a driver, but it is practical and reasonably safe because there is no right-turning traffic from Commonwealth Avenue, and traffic on Charlesgate East is not permitted to turn right on a red light. Crossing two legs of an intersection in crosswalks to get to the bike lane on the far side involves waiting through an additional signal phase. Also, a Boston ordinance prohibits riding a bicycle on a sidewalk.
One way of resolving the issue of the traffic signal’s changing as a bicyclist enters the bike box is to enable entry concurrent with a pedestrian signal interval. Then bicyclists must wait before entering the bike box and again once having crossed it. Considering the percentage who are unwilling to wait even through one signal interval, there would probably be even more resistance to waiting through two. Another blog post, with a video, examines travel times through two intersections in Phoenix, Arizona with this type of crossing. The travel times are unreasonably long.
Legalizing bicyclists’ crossing Charlesgate East when motorists are held back would require a separate bicycle signal. A green signal for bicyclists after the green signal for cross traffic would not delay many motorists. There would be significant delay though, for bicyclists, tempting them to run the red light. The earlier they can cross before parallel motor traffic starts, the more time they have to merge before motor traffic behind them starts up. How soon the traffic clears is going to vary greatly with time of day.
I’d like to make a case for a “bicycle boulevard”– a street which bicyclists can use for through travel, but where barriers and diverters require motorists to turn at the end of the block, on Marlborough Street, to the north of Commonwealth Avenue; and/or Newbury Street, to the south. There would have to be a new bridge across the Muddy River at Charlesgate; for Newbury Street, also a tunnel under a ramp to the overpass; or Marlborough Street, a connection under the Bowker Overpass to Beacon Street and Bay State Road. I have suggested elsewhere that Bay State Road be reconfigured as a two-way bicycle boulevard.
Such a bridge might be an element of a redesign of Charlesgate Park — originally an attractive link between Olmsted’s Emerald Necklace park system and the Charles River Esplanade, now blighted by the Bowker Overpass which looms over it. However, the Bowker overpass crosses the Massachusetts Turnpike Extension, a limited-access highway. Restoring ground-level access while maintaining access across the Turnpike would require major reconstruction.

